Technical Analysis Using Multiple Timeframe: Trading with the Market, Not Against It by Vivek Kumar, CMT, CFTe
- Vivek Kumar, CFTe, CMT L3 Cleared

- Dec 28, 2025
- 8 min read
The concept of Technical Analysis using Multiple Timeframes involves analyzing the same financial asset across different time intervals—such as weekly, daily, 75 Min, and hourly—to gain a comprehensive view of market dynamics. While a single timeframe may show a bullish signal, the "bigger picture" might reveal a major resistance level that a single-chart trader would miss. By integrating Multiple Timeframe Analysis, traders can align their short-term actions with long-term trend, effectively "trading with the wind at their back."
Table of Contents
Mastering the Market: The Ultimate Guide to Technical Analysis using Multiple Timeframes
In the fast-paced world of financial markets, the biggest mistake a trader can make is "tunnel vision." Relying on a single chart to make financial decisions is like trying to navigate a city using only a microscope. To truly understand where the price is headed, you must employ Technical Analysis using Multiple Timeframes.
Professional traders use Technical Analysis using Multiple Timeframes to distinguish between a minor "hiccup" in price and a major trend reversal. By looking at various time intervals, you gain a 3D view of the market, allowing you to see the "forest" (the long-term trend) and the "trees" (the individual trade setups) simultaneously.
The Psychology of Timeframes in Technical Analysis
To excel at Technical Analysis using Multiple Timeframes, one must understand that different participants dominate different intervals. The Weekly and Monthly charts are the domain of institutional "Big Money"—banks, hedge funds, and governments. Their moves are slow but powerful. As many of these big institutions are not engaged in taking intraday trades due to multiple constraints hence rely on comparatively bigger trends.
When you perform Technical Analysis using Multiple Timeframes, you are essentially looking for the "footprints" of these institutions. If the "Big Money" is buying on a Weekly basis, your intraday "sell" signal on a 15-minute or 5-minute chart is likely a "trap". Effective Technical Analysis using Multiple Timeframes teaches you to respect the dominant force of the higher timeframe while using the lower timeframe for surgical precision.
Choosing Your Timeframes: The Rule of Three
A common hurdle in Technical Analysis using Multiple Timeframes is "Analysis Paralysis." If you look at too many charts, you will always find conflicting signals. The gold standard for Technical Analysis using Multiple Timeframes is using exactly three timeframes:
The Anchor (Higher): Used to define the primary trend.
The Context (Intermediate): Used to identify the current trading environment and setups.
The Execution (Lower): Used to time your entry and manage risk.
For a swing trader, Technical Analysis using Multiple Timeframes might involve the Weekly (Anchor), Daily (Context), and 75-minute or 1-Hour (Execution) charts. While, for a day trader, it might be the 75-minute / 1-Hour, 15-Minute, and 3-Minute charts.
Considering the fractal nature of trend in technical analysis, I have learnt during my CMT (Chartered Market Technician) preparation to multiple the bigger trend by multiplying the current timeframe by '5'. Like - If I am trading in Daily timeframe, I shall be using Weekly timeframe (Daily X 5 = 5 Days = 1 Week) to discern the major trend and for execution I shall be looking at 75 Min chart (1 Day = 375 Min hence 375/5 = 75 Minute). Please note this 375 minute = 1 Day rule is applicable for Indian Markets as on writing this blog. In case, you are reading this from another country, please calculate this easily as per your country's exchange trading time.
Mastering Trend Confirmation with Multiple Timeframes
The core objective of Technical Analysis using Multiple Timeframes is trend alignment. In a "Perfect Setup," all three of your chosen timeframes point in the same direction.
Example - When conducting Technical Analysis using Multiple Timeframes, a defined rule is a must to conduct this research. Here we will take a simple yet reliable rule of using '20 period Simple Moving Average' as a rule to define the Stock is in Uptrend if it is trading above it.
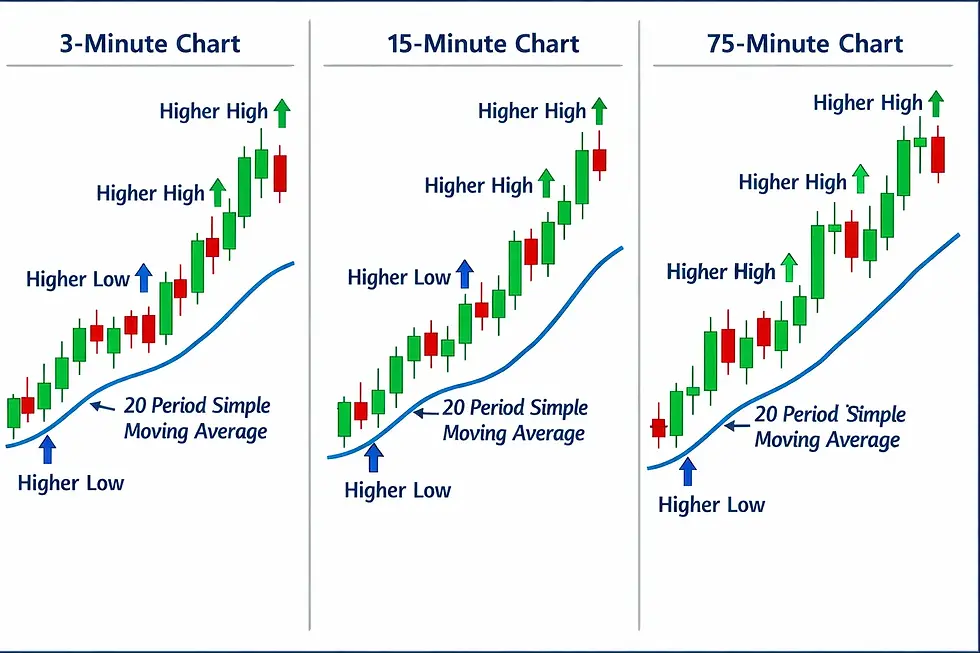
Now here in this above mentioned illustrative image, we can observe that the biggest timeframe here i.e. 75 Minute chart is showing a clear uptrend as the stock is above 20 period SMA (simple moving average) so we may say that our "Primary Trend is uptrend".
Now the middle column chart is a 15 minute chart which is also confirming that the stock is above 20 SMA which indicates our "Intermedia Trend is also in uptrend"
Finally, the right most column i.e. 3 minute chart is also confirming that the stock is above 20SMA which indicates our "Minor Trend is also in uptrend".
Now, we can trade all the Bullish Patterns forming in 3 minute chart timeframe with higher confidence.
The Top-Down Approach to Market Analysis
The professional way to execute Technical Analysis using Multiple Timeframes is "Top-Down." You always decide the criteria of Uptrend / Downtrend first as per your trading strategy and then start with the largest timeframe first. Take an example of a Swing Trader who also uses a 20SMA rule to define trend:
Step 1: Look at the Weekly chart. Is it trending Up or Down?
Step 2: Move to the Daily. Is there a setup forming in the direction of the Weekly trend?
Step 3: Move to the Execution chart. Wait for the exact moment the trend resumes.
By following this disciplined routine for Technical Analysis using Multiple Timeframes, you ensure that you never "fight the tape."
Identifying High-Probability Entry Points
The beauty of Technical Analysis using Multiple Timeframes is that it allows for tighter stop-losses. If your price chart tells you the Weekly and Daily trend is up, you don't need to place a massive stop-loss based on Weekly or Daily volatility. Instead, you can find a support level on the 75-minute chart and place a tight stop-loss there, significantly increasing your Risk-to-Reward ratio. This is the primary reason why Technical Analysis using Multiple Timeframes is the preferred method for elite proprietary trading firms.
Avoiding Common Pitfalls in Multi-Timeframe Trading
While Technical Analysis using Multiple Timeframes is powerful, beginners often fall into the trap of "Confirmation Bias." They might want to buy a stock so badly that they ignore a bearish Weekly chart and only focus on a bullish Daily and 75-minute chart and buy the stock.
To avoid this, your Technical Analysis using Multiple Timeframes must be rule-based. If the Anchor timeframe is bearish, you are forbidden from taking a long trade, no matter how good the 75-minute / 15-minute / 5-minute chart looks. True Technical Analysis using Multiple Timeframes requires the discipline to walk away when timeframes are in conflict.
Advanced Indicators for Multi-Timeframe Confluence
Experienced practitioners of Technical Analysis using Multiple Timeframes often use specific indicators that track data from other charts. For example, "MTF Moving Averages" allow you to see the Daily 20-period SMA while you are looking at a 75-minute chart.
Incorporating these tools into your Technical Analysis using Multiple Timeframes allows for "Confluence." When uptrend on your 3-minute chart and 15-minute chart overlaps perfectly with an uptrend on your Daily chart, you have a confirmed uptrend. Trades taken at these confluence trend, identified through Technical Analysis using Multiple Timeframes, have the highest probability of success in the market.
Conclusion and Next Steps
Technical Analysis using Multiple Timeframes is not just a technique; it is a mindset. It forces you to be patient, to respect the big picture, and to wait for the market to align in your favor. By committing to Technical Analysis using Multiple Timeframes, you are moving from a "gambler" mindset to a "strategist" mindset.
Share your recent trade ideas using multiple timeframe analysis in the comment section below.
Download the 1 Pager Cheat Sheet to ensure you are taking the right trade for FREE.[No Signup Required]
Traders frequently ask the below mentioned questions to Vivek Kumar, CMT, CFTe on multiple timeframe trading topic:
What is Technical Analysis using Multiple Timeframes?
It is the practice of analyzing an asset on at least two or three different time intervals to confirm trends and find better entries.
Why should I use Technical Analysis using Multiple Timeframes?
It helps you avoid false signals on lower charts and ensures you are trading in the direction of the major institutional money.
Which timeframes are best for Technical Analysis using Multiple Timeframes?
It depends on your style. Swing traders use Weekly/Daily/4-Hour. Day traders use 1-Hour/15-Min/5-Min.
Can beginners learn Technical Analysis using Multiple Timeframes?
Yes, but they must start with a "Top-Down" approach and not get distracted by the "noise" of very low timeframes like the 1-minute chart.
What is the "Rule of Three" in Technical Analysis using Multiple Timeframes?
The rule suggests using three timeframes: one for the major trend, one for the setup, and one for the entry trigger.
Does Technical Analysis using Multiple Timeframes work for Crypto?
Absolutely. Technical Analysis using Multiple Timeframes is highly effective in volatile markets like Crypto and Forex to identify real breakouts.
What are the common mistakes in Technical Analysis using Multiple Timeframes?
The most common mistake is ignoring the higher timeframe trend because a lower timeframe looks tempting.
Do I need special software for Technical Analysis using Multiple Timeframes?
Most modern platforms like TradingView or Wix-integrated charts support Technical Analysis using Multiple Timeframes by allowing split-screen views.
How does Technical Analysis using Multiple Timeframes improve risk management?
It allows you to place tighter stop-losses based on lower timeframe levels while targeting profits based on higher timeframe trends.
Is Technical Analysis using Multiple Timeframes better than single timeframe analysis?
Yes, because it provides context. A single timeframe shows you "what" is happening, but multiple timeframes show you "why" it is happening.
Technical Analysis using multiple timeframe is a structured approach to market analysis that involves studying the same asset across higher, intermediate, and lower time horizons to gain a complete and objective view of price behavior. Rather than relying on a single chart, this method helps traders understand the dominant trend, market context, and precise execution levels simultaneously. The roots of Technical Analysis using multiple timeframe can be traced back to early Dow Theory in the late 19th and early 20th centuries, where market trends were classified into primary, secondary, and minor movements. This concept was later refined by professional traders and institutional desks as markets became faster and more complex, making single-timeframe analysis insufficient for consistent decision-making. In modern financial markets, Technical Analysis using multiple timeframe is highly relevant due to the presence of diverse market participants—from long-term institutions operating on weekly and monthly charts to high-frequency traders active on intraday timeframes. By aligning trades with the higher-timeframe trend while executing entries on lower charts, traders reduce noise, avoid false signals, and improve risk-to-reward efficiency. One of the key advantages of Technical Analysis using multiple timeframe is its ability to filter low-probability trades and prevent emotional, reactive decision-making. It encourages a top-down, rule-based approach where higher timeframes define direction and lower timeframes provide timing, making it a preferred framework among professional traders, portfolio managers, and proprietary trading firms. Overall, Technical Analysis using multiple timeframe is not merely a technical tool but a trading philosophy that emphasizes patience, discipline, and alignment with market structure. Its continued relevance across equities, commodities, forex, and cryptocurrencies underscores its importance as a foundational skill for traders seeking consistency in dynamic markets.


Great sharing of advanced concepts