Shocking: Volume Analysis in Trading Secrets Most Losing Traders Simply Ignore
- Vivek Kumar, CFTe, CMT L3 Cleared

- Mar 17
- 10 min read
Here is a question I ask every trader I work with. You are looking at a stock that has just broken out above a major resistance level. The candle is bullish. Price has moved up 3%. Do you enter the trade?
Most traders say yes immediately.
But my next question stops them cold: What was the volume on that breakout candle? Price without volume context is half a story. And volume analysis in trading is the chapter that reveals whether the story has conviction — or whether you are about to walk into a trap. After more than a decade of full-time trading, I can tell you that volume is one of the most underutilised and misunderstood tools in a retail trader's arsenal.
Why Volume Analysis in Trading Is the Market's Lie Detector
Think of price as what a market participant says. Volume is what they do. And as any experienced trader knows — actions speak far louder than words.
When a stock rallies on high volume, it means a large number of market participants are actively buying at those prices. The move has institutional conviction behind it. It is far more likely to continue. When a stock rallies on thin, below-average volume, it means the move is happening in a vacuum — there is no real conviction, and the rally is far more vulnerable to a quick reversal.
Volume analysis in trading is essentially a conviction meter. It does not predict direction — it validates or invalidates what price is already doing.
The Four Core Volume Signals Every Trader Should Know
1. Volume Expansion on Breakouts — The Gold Standard
When a stock breaks out of a consolidation range, a resistance level, or a chart pattern on volume that is at least 150-200% of its 20-day average volume, that is a high-conviction breakout. The logic is clear: the breakout is attracting significant buying interest. Institutions, mutual funds, and large participants are entering at those levels. The move is likely to have legs.
A genuine breakout from a chart pattern must be accompanied by volume expansion, or the probability of a false breakout increases dramatically. In Indian midcap and smallcap stocks — which I particularly focus on for swing trading setups — volume expansion on breakouts is one of the most reliable filters available.
2. Volume Contraction During Pullbacks — The Healthy Correction Signal
This is one of my favourite volume analysis signals. When a stock in an uptrend pulls back on declining volume — each down-day showing lower volume than the day before — it tells you that the sellers do not have conviction. The pullback is a natural, low-energy correction, not the beginning of a reversal.
When you see a high-volume breakout followed by a low-volume pullback to support, that is a textbook setup. The institutional buyers who drove the breakout are not selling — they are holding. I always pair this volume context with the volatility context of each move using ATR to understand whether the pullback is within normal range or unusually deep.
3. Climax Volume — The Exhaustion Signal
Climax volume is when a stock makes a sharp, extended move on exceptionally high volume — often the highest volume bar in weeks or months. Instead of signalling continuation, climax volume often signals exhaustion. When a stock that has been rallying for weeks suddenly spikes up 5-7% on volume 3-4 times its average, it often means the last remaining buyers have all rushed in simultaneously. There is no one left to buy. And when that happens, the move tends to reverse sharply.
Climax volume at the top of a prolonged uptrend is one of the most reliable warning signs in volume analysis in trading. It is the market's way of signalling that the rally has become a crowd trade — and crowd trades end badly for the last participants.
4. On-Balance Volume (OBV) — The Smart Money Tracker
On-Balance Volume (OBV) is a cumulative indicator that adds volume on up-days and subtracts volume on down-days. The result is a running total that tracks whether volume is flowing into or out of a stock over time.
When a stock's price is making new highs but OBV is declining — negative divergence — it signals that volume is not confirming the price move. Smart money may be distributing (selling) into the rally while price still appears strong. This is a powerful early warning of a potential reversal. Conversely, when price is flat or slightly declining but OBV is rising — positive divergence — it signals accumulation. I note this in my trading journal as part of my weekly market review.
Market Breadth — Volume Analysis at the Index Level
Volume analysis in trading extends beyond individual stocks to the broader market. Market breadth indicators measure the health of the overall market — whether the advance is broad-based or narrow.
The Advance-Decline (A/D) Line tracks how many NSE stocks are advancing versus declining on a given day. When Nifty 50 is making new highs but the A/D Line is flat or declining — breadth divergence — it signals that the index's rally is being driven by a handful of large-caps while the broader market is not participating. This is a warning sign that the rally may be nearing exhaustion.
On healthy trending days, you want to see broad breadth: 60-70%+ of stocks advancing, high total market volume, and the A/D Line in an uptrend alongside Nifty 50.
A Simple Volume Analysis Checklist
Before entering any trade, I run through this quick volume checklist:
Question 1 — Is today's volume above or below the 20-day average?
Question 2 — If a breakout: is volume at least 150% of the 20-day average?
Question 3 — If a pullback setup: is volume declining (healthy) or expanding (unhealthy)?
Question 4 — Is OBV in an uptrend alongside price (confirmation), or diverging (warning)?
Question 5 — Is the broader market showing healthy breadth today, or is the rally narrow?
Five questions. Thirty seconds. But they can save you from a significant number of failed trades.
Final Thoughts
Volume is the market speaking its truth. Price can be manipulated in the short term. Breadth can be skewed by index weighting. But volume — the actual number of shares that changed hands — is the raw data of conviction.
Make volume analysis in trading a non-negotiable part of every trade evaluation. Not as a complex system — just as a consistent habit of asking: Does the volume support what price is doing? That single question, applied consistently, will upgrade the quality of your trade selection immediately.
If you want to go deeper into volume analysis in trading and understand how to apply it specifically to your setups — whether you trade stocks, futures, or options — I am happy to walk through it with you in a one-on-one session. Many traders are surprised by how quickly this one addition transforms their ability to read market intent. Let's connect
Frequently Asked Question
Q1. What is volume analysis in trading?
Volume analysis in trading is the study of the number of shares or contracts traded in a given period, used to assess the conviction and sustainability behind price movements. Every price move tells you what happened. Volume tells you whether to believe it. High volume on a price move suggests strong participation and higher probability of continuation. Low volume on a price move suggests weak conviction and a higher risk of reversal. Volume analysis in trading is essentially a tool for reading market intent behind the price action you see on your chart.
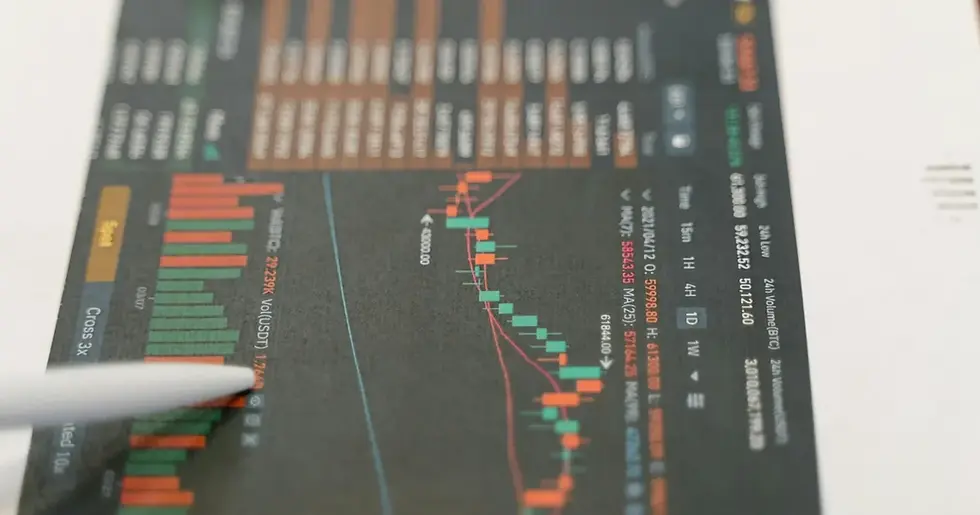
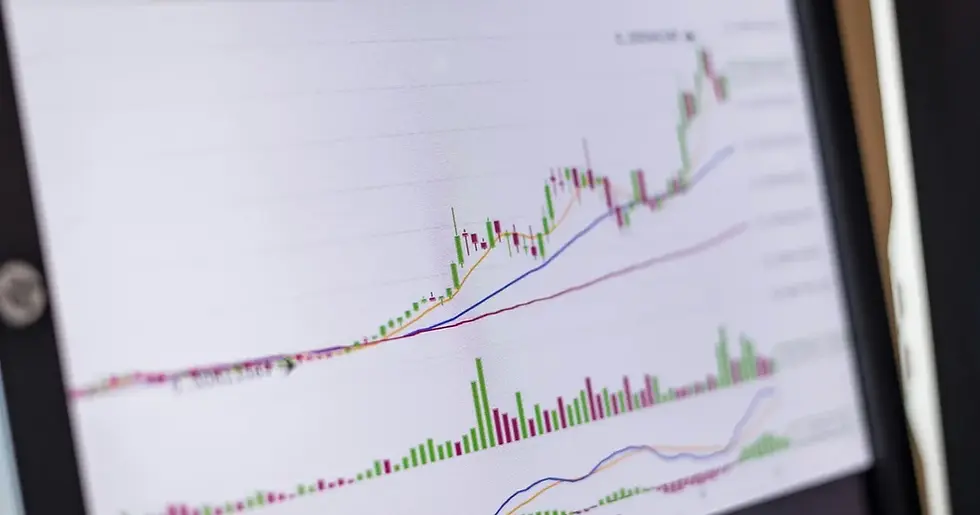
Q2. How do I read volume bars on a chart?
Volume is typically displayed as vertical bars at the bottom of a price chart. Each bar represents the total number of shares traded during that candle's time period. The colour of the volume bar — green for up-days, red for down-days — tells you whether the volume was associated with buying or selling pressure. The height of the bar relative to surrounding bars tells you whether volume was above or below recent averages. I recommend overlaying the 20-day average volume as a reference line to quickly identify when volume is unusually high or low on any given session.
Q3. What is a high-volume breakout and why is it important?
A high-volume breakout occurs when price breaks above a key resistance level or chart pattern boundary while the trading volume for that session is significantly above the recent average — typically 150-200% or more. This elevated volume signals that the breakout is attracting real institutional buying interest, not just opportunistic retail speculation. High-volume breakouts have a substantially higher follow-through rate than low-volume breakouts, making volume confirmation one of the most important filters in any breakout trading strategy.
Q4. What does low volume on a pullback tell me?
Low volume on a pullback is a positive signal within the context of an uptrend. When a stock pulls back on declining, below-average volume, it means sellers do not have the conviction or the numbers to push price lower aggressively. The path of least resistance remains upward. This volume analysis pattern — high-volume breakout followed by low-volume pullback — is one of the cleanest entry setups available in technical trading and is especially reliable in the context of strong trending stocks on Indian markets.
Q5. What is On-Balance Volume (OBV) and how do I use it?
OBV is a cumulative volume indicator developed by Joe Granville in the 1960s. It adds volume on days when price closes higher and subtracts volume on days when price closes lower, producing a running total. When OBV is trending upward alongside price, it confirms that buyers are in control. When OBV diverges from price — particularly when price makes new highs but OBV does not — it is a warning that smart money may be distributing into the rally. OBV divergence is one of the most reliable early warning signals available through volume analysis in trading.
Q6. How is volume analysis used for Indian stock market trading?
In the Indian market context, volume analysis in trading is particularly valuable for identifying genuine institutional activity versus operator-driven moves in midcap and smallcap stocks. Stocks with thin average volumes are prone to price manipulation by operators — artificial price inflation followed by distribution to retail buyers. Volume analysis helps you identify these patterns: operator-driven moves often show erratic volume spikes without follow-through, while genuine institutional accumulation shows consistently rising OBV and clean volume expansion on breakouts.
Q7. What is market breadth and how does it relate to volume?
Market breadth measures the participation level of the overall market in a price move. Key breadth indicators include the Advance-Decline Line (number of stocks rising versus falling), the percentage of stocks above their 200-day moving average, and the McClellan Oscillator. Breadth confirms whether a market rally is broad-based (healthy) or narrow (potentially fragile). Volume analysis at the individual stock level and breadth analysis at the market level are complementary tools — together they give you a complete picture of market health and conviction.
Q8. Can volume analysis work for F&O trading in India?
Yes, with some important nuances. For equity futures on NSE, volume data is directly interpretable using the same principles as for stocks. For options, open interest (OI) is a more relevant metric than volume alone — it shows the number of outstanding contracts and where the positioning is concentrated. Significant changes in open interest alongside price moves reveal whether new money is entering or existing positions are closing. Using OI alongside price action is the options trader's equivalent of volume analysis in trading.
Q9. What does climax volume look like and how do I spot it?
Climax volume appears as an exceptionally tall volume bar — often 3-5 times the recent average — associated with a sharp, extended price move in one direction. It typically appears after a prolonged trend when the last wave of participants rushes in. The price bar associated with climax volume is often a large, one-directional candle. In the following sessions, price frequently reverses sharply as the buying exhaustion becomes apparent. Climax volume is more common in individual stocks than in indices and is particularly frequent in high-momentum midcap stories in India.
Q10. How should I incorporate volume analysis into my existing trading setup?
Start with two simple additions. First, before entering any trade, check whether volume is above or below the 20-day average and whether it supports or contradicts the price signal you are acting on. Second, add the OBV indicator to your chart and check whether it is confirming or diverging from price. These two additions require no new charts, no new subscriptions, and less than a minute per trade — but they will immediately improve the quality of your trade selection by filtering out low-conviction setups.
Volume analysis in trading has a history that predates modern technical analysis, rooted in the tape-reading practices of early twentieth-century stock market operators in the United States. Richard Wyckoff, one of the most influential market analysts of the early 1900s, placed the relationship between price and volume at the centre of his analytical method. Wyckoff's approach to volume analysis in trading — which distinguished between accumulation phases (smart money buying quietly on low volume), markup phases (high-volume breakouts), distribution phases (selling into high-volume rallies), and markdown phases — remains one of the most sophisticated frameworks for reading institutional behaviour through the volume lens. Joseph Granville formalised the concept of On-Balance Volume (OBV) in the 1960s, providing traders with a simple cumulative tool to track whether volume was flowing into or out of a security over time. His foundational insight — that volume precedes price — became a cornerstone of modern volume analysis in trading and influenced generations of technical analysts and traders who followed. The advance of computing power in the 1980s and 1990s expanded the scope of volume analysis in trading to include market breadth indicators, advance-decline statistics, and institutional flow tracking tools. The CMT (Chartered Market Technician) programme formally incorporates volume analysis and market breadth as core competencies in technical analysis, recognising their indispensable role in comprehensive market assessment. For Indian retail traders, volume analysis in trading carries particular significance due to the structural characteristics of NSE and BSE markets. India's markets include a large number of illiquid midcap and smallcap stocks that are prone to price manipulation by operators — a well-documented phenomenon in domestic equity markets. Volume analysis in trading provides retail traders with the clearest available signal to distinguish genuine institutional activity from artificially inflated price moves designed to attract retail buyers before distribution. The NSE provides publicly accessible data on delivery-based trading as a percentage of total volume — a uniquely Indian addition to volume analysis in trading. High delivery percentage alongside high total volume on a breakout day is an exceptionally strong confluence signal, indicating that buyers are not just speculating but are taking actual delivery of shares. This delivery volume data, combined with standard volume analysis in trading principles, gives Indian retail traders a powerful edge that is not available in many other markets.


Comments