Warning: Misreading the Overbought Oversold Indicator Costs You Proven Profits
- Vivek Kumar, CFTe, CMT L3 Cleared

- Mar 25
- 9 min read
I've seen it happen hundreds of times — including to myself in the early years. The RSI crosses above 70 and the trader sells short. The price climbs another 15%. Or the RSI drops below 30 and the trader buys, expecting a bounce — only to watch the stock fall another 20%.
The overbought oversold indicator isn't broken. Your interpretation of it is.
This is one of the most expensive misunderstandings in retail trading. Traders treat the overbought oversold indicator as a direct buy or sell signal. It is not. It is a market condition descriptor — and understanding that single difference can transform how you trade entirely.
What You Will Learn in This Blog
What Is the Overbought Oversold Indicator?
An overbought oversold indicator is a momentum-based technical tool that measures how fast and how far a price has moved over a specific period. The most widely used versions are RSI and the Stochastic Oscillator — both oscillate between 0 and 100. Readings above 70 signal overbought; readings below 30 signal oversold. This sounds logical — but only under very specific market conditions.
Think of it like a pressure gauge on a pressure cooker. High pressure often means steam is about to release. But in an industrial boiler running at full capacity, high pressure can persist far longer. Markets in strong trends behave exactly like that boiler.

Why RSI Alone Will Mislead You in Trending Markets
The overbought oversold indicator was designed for range-bound markets. When a market is trending strongly, momentum can stay in overbought or oversold territory for weeks, even months. During the 2020–2021 bull run in Indian markets, Nifty 50 constituent stocks stayed in RSI overbought territory above 70 for months. Traders who shorted 'overbought' levels were repeatedly stopped out.
This is why trend analysis must always come before indicator reading. Before you look at an overbought oversold indicator value, ask: am I in a trending market or a ranging market? That single question changes everything.
The Stochastic Oscillator — A Second Perspective
The Stochastic Oscillator measures the closing price relative to its high-low range over a set period viz. 14 period. Readings above 80 are overbought, below 20 are oversold. Like RSI, it misfires badly in trending conditions. It is most useful in range-bound markets where price oscillates predictably between support and resistance. When I began trading, this was the only indicator that often led to my losses. The fault wasn't with the indicator but with me, as I expected a truck to navigate a narrow road at high speed. I should have realized that this road was more suited for a hatchback, not a truck. My mistake!
The Golden Rule: Context Before the Signal
Context first, signal second.
Step 1: Identify the trend using a 50 or 200-period moving average.
Step 2: Define the market structure.
Step 3: Apply the overbought oversold indicator with context established. In a ranging market, overbought = look to sell near resistance.
In a trending market, overbought = momentum confirmation, not reversal.
This framework must sit inside a larger structured trading plan — where all rules are written down before you touch a single trade.
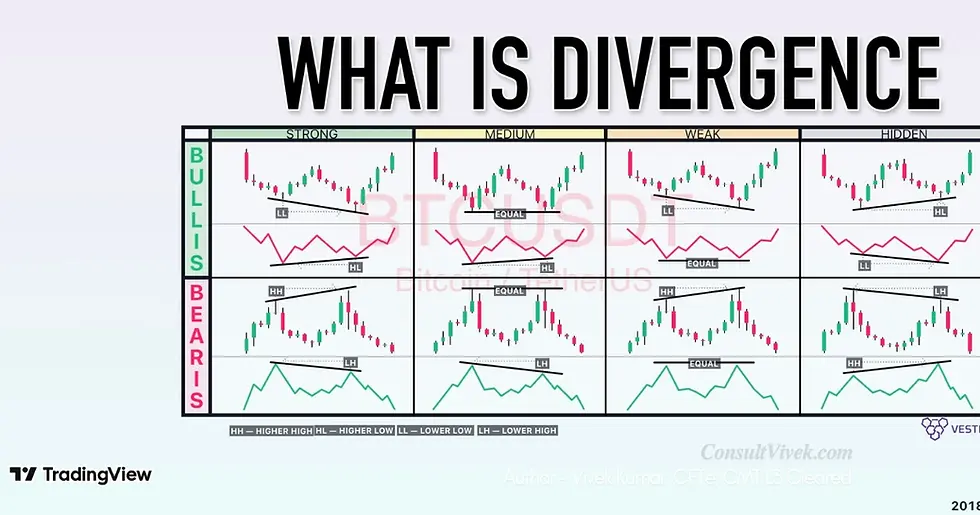
How to Use Divergence to Confirm Your Trades
Bearish divergence: Price makes a higher high, but RSI makes a lower high — weakening momentum at resistance.
Bullish divergence: Price makes a lower low, but RSI makes a higher low — fading selling momentum at support.
Divergence is a comparison, not a threshold. Combined with candlestick confirmation, divergence is one of the most reliable signals in my toolkit and the one which has the real power to catch the bottom sometimes.
Bollinger Bands as a Complementary Filter
Bollinger Bands wrap two standard deviations above and below a 20-period moving average. When price touches the upper band AND RSI is above 70, you have confluence. Managing market volatility correctly matters here too.
Common Mistakes Traders Make With These Indicators
Mistake 1: Trading the level alone.
Mistake 2: Using only one timeframe.
Mistake 3: Ignoring stop-loss placement — trading without a pre-defined exit turns small mistakes into large losses.
A Practical Setup: Combining Signals the Right Way
My personal framework:
(1) Identify trend on daily chart using 200-day MA.
(2) Wait for pullback on 60-minute chart or a 75-minute chart.
(3) Look for RSI dip below 40 in uptrend.
(4) Confirm with bullish divergence on 60-minute.
(5) Enter on bullish candlestick.
(6) Stop below swing low.
(7) Target minimum 2:1 risk-reward but prefer trades which has 3:1 risk-reward potential (Calculate the distance between Buy Price - Stop Loss for Risk and Nearest Resistance - Buy Price for Reward).
Tools & Further Reading I Recommend
Charting & Technical Analysis Platform: I use TradingView — covers NSE, BSE and global markets with professional-grade charting tools on web, desktop and mobile. If you are not already using it, I strongly recommend it. It will certainly take your Charting skills to the next level. |
Further Reading: For anyone who wants to go deeper on this topic, the book I recommend is New Concepts in Technical Trading Systems by J. Welles Wilder — This is the book that literally invented RSI in 1978. If you want to understand the overbought oversold indicator at its deepest level, go straight to the source. Wilder explains the exact calculation, the rationale, and the original intended application — all of which makes you a far better interpreter of the indicator than someone who simply learned to trade the 70/30 levels. Available on Amazon India via the link above. |
Disclosure: This blog contains affiliate links. If you purchase a product or open an account through these links, I may earn a small commission at no extra cost to you. I only recommend tools and books I personally use or consider genuinely valuable for serious traders. |
If false signals from the overbought oversold indicator have been costing you trades, you're not alone — and it's not your fault. Most traders were never taught how to combine context, divergence, and multi-timeframe analysis correctly. That's exactly what I cover in my 1-on-1 trading consultancy. We work through your actual charts, your actual timeframes, and build a system that fits how you trade.
If you'd like to work with me directly, reach out here:
Frequently Asked Questions
Q1. What is an overbought oversold indicator?
An overbought oversold indicator is a momentum oscillator that measures the speed and magnitude of recent price movements over a defined period. The most widely used versions are the Relative Strength Index (RSI) and the Stochastic Oscillator. Both oscillate between 0 and 100, with readings above 70 signalling overbought conditions and readings below 30 signalling oversold conditions. These readings describe market conditions — they are not automatic buy or sell instructions and must always be interpreted within the broader market context.
Q2. What is the best period setting for the RSI overbought oversold indicator?
The default 14-period setting works well for most traders across daily and weekly timeframes. For shorter-term intraday trading, a 9-period RSI produces quicker but noisier signals, while positional traders sometimes prefer 21 or 25 periods for smoother readings. The key is consistency — pick a setting, test it on your specific instrument and timeframe, and stick with it. Changing settings weekly based on recent results is a form of curve-fitting that will hurt your performance over time.
Q3. Can the RSI stay overbought for a long time without a reversal?
Absolutely — and this is one of the biggest sources of confusion for retail traders. In strong uptrends, RSI can stay above 70 for weeks or even months without a meaningful correction. This is completely normal behaviour in a trending market. The overbought oversold indicator signals extreme momentum — not an imminent price reversal. In trending conditions, sustained overbought RSI readings should be treated as momentum confirmation of the trend, not as sell signals.
Q4. What is the difference between RSI and Stochastic as overbought oversold indicators?
RSI measures the magnitude of price changes over a set period relative to previous closes. The Stochastic Oscillator compares the most recent closing price to the high-low range over the same period. The Stochastic tends to be more sensitive and generates more frequent signals — which means more noise in trending markets. RSI is generally smoother and more widely used in trend-following contexts. Both are valuable, but each works best in the appropriate market environment, making context assessment essential before applying either.
Q5. How do I use the overbought oversold indicator in the Indian stock market?
In Indian markets — particularly for Nifty 50 and Nifty Midcap 150 stocks — the overbought oversold indicator works best when combined with broader market context. During strong budget rally seasons or post-RBI policy rallies, markets can stay in overbought territory for extended periods. Always check the broader index trend before acting on any individual stock RSI reading. A stock that is overbought may simply be participating in a healthy market-wide rally rather than signalling an imminent reversal.
Q6. What is RSI divergence and why does it matter?
RSI divergence occurs when price and the RSI indicator move in opposite directions simultaneously. Bearish divergence happens when price makes a higher high but RSI makes a lower high — signalling weakening momentum despite rising prices. Bullish divergence occurs when price makes a lower low but RSI makes a higher low — indicating that selling momentum is fading even as price declines further. Divergence is one of the most reliable applications of the overbought oversold indicator because it provides comparative momentum data rather than a simple threshold crossing.
Q7. Should I combine the overbought oversold indicator with other tools?
Yes — always. The overbought oversold indicator works best when combined with trend direction (moving averages), support and resistance levels, candlestick confirmation patterns, and volume analysis. The more independent tools that simultaneously confirm the same signal, the higher the probability of that trade working out. Think of building a case for a trade using multiple pieces of evidence, rather than acting on a single indicator reading.
Q8. Is the overbought oversold indicator reliable for day trading?
It can be useful for intraday trading, but requires greater caution due to market noise on shorter timeframes. RSI readings on a 5-minute or 15-minute chart can flip rapidly and generate numerous false signals. For day trading, use the RSI on the 5 or 15-minute chart in conjunction with the 60-minute chart context. If the 60-minute RSI confirms a clear trend direction, look for the shorter-timeframe RSI to dip into oversold territory (in an uptrend) as an entry signal aligned with the larger trend.
Q9. How do Bollinger Bands relate to the overbought oversold concept?
Bollinger Bands are a form of statistical overbought oversold measure. When price touches or moves beyond the upper Bollinger Band, it is in statistically extended territory — more than 2 standard deviations above the 20-period average. Using Bollinger Bands alongside RSI gives you two independently calculated systems confirming the same overbought or oversold condition, which significantly increases the reliability and confidence of the signal.
Q10. Can beginners use the overbought oversold indicator effectively?
Yes, but proper guidance is essential. The overbought oversold indicator is deceptively simple — the levels are easy to read, which is precisely why beginners fall into the trap of trading them blindly without context. The fundamental lesson every beginner must internalise is that overbought and oversold readings describe market conditions, not instructions to trade. Once you understand the difference between trending and ranging markets, and once you learn to identify divergence rather than just threshold crossings, this indicator becomes a genuinely valuable part of your trading toolkit.
The overbought oversold indicator has its roots in the mid-20th century, born from the need to quantify market momentum in a systematic and repeatable way. J. Welles Wilder Jr. introduced the Relative Strength Index — arguably the most famous overbought oversold indicator ever created — in his landmark 1978 book New Concepts in Technical Trading Systems. Wilder designed the RSI to measure the ratio of average gains to average losses over a defined lookback period, expressed as a number between 0 and 100. His original 14-period setting remains the most widely used configuration globally to this day, more than four decades after its introduction. The Stochastic Oscillator, another prominent overbought oversold indicator, was developed by George Lane in the 1950s. Lane designed it to compare the most recent closing price to the high-low range over a set period, based on his observation that prices tend to close near their highs in uptrends and near their lows in downtrends. Both of these overbought oversold indicator tools were built for an era of slower-moving, primarily range-bound markets. As global financial markets became more interconnected and trend-driven through the 1990s and 2000s, practitioners began identifying significant limitations in applying these tools during strongly trending environments. This led to important refinements in methodology — most notably the widespread adoption of divergence analysis and multi-timeframe confirmation as standard practices. In India, the overbought oversold indicator gained mainstream retail adoption with the proliferation of online trading platforms in the early 2000s. Unfortunately, without structured education, most Indian retail traders continue to apply the overbought oversold indicator in its most basic form — treating the 70 and 30 levels as automatic reversal signals, ignoring trend context entirely. Today, the overbought oversold indicator occupies a central place in modern technical analysis education globally, including in the CMT and CFTe examination curricula. For Indian retail traders, mastering the correct contextual application of the overbought oversold indicator represents one of the highest-leverage improvements possible in their technical toolkit.


Comments